Are Carbs the Cause of Obesity?
Now depending who you talk to the answer will vary. Answers may include:
- keto
- low fat
- intermittent fasting
- cleanse or detox
- whole foods
- raw foods
- vegetarian
- vegan
- IIFYM (aka if it fits your macros)
- flexible dieting
Get's kind of confusing doesn't it? Paralysis by analysis comes to mind.
Recently a colleague shared a graph on his social media. And it caught my attention and became the foundation for this post.
Here's the graph:
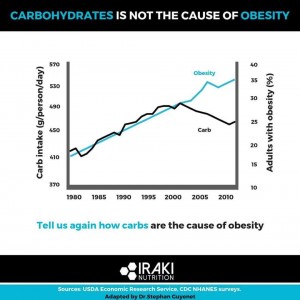
[caption id="attachment_5560" align="aligncenter" width="300"] Carbohydrate intake and percentage of adults with obesity over time.
Here's what the graph shows:
One the left vertical axis is carb intake in grams/person/day. The range is from the low 400s to the mid 500s per day.
On the right vertical axis is the percentage of adults with obesity.
On the horizontal axis is time in years from around 1980 to 2010.
Two lines are plotted on the graph. In black we can see the consumption of carbs. And a black line represents the percentage of individuals with obesity.
A few observations from this graph include:
- Carb intake increased steadily from 1980 to 2000. From 2000 to 2010 carb intake has been on the decline.
- Obesity rates have increased steadily from 1980-2010
- The graph is based on a certain population i.e. obese individuals.
- We don't know anything about the quality of the carbohydrates consumed.
First of all, we understand carb intake was reduced. Was caloric intake reduced as well? Or were carb calories replaced with additional protein or fat?
I haven't dug into the reference for this graph so can't comment on what else changed with the population. Has nutritional quality decreased? Have activity levels dropped off? Have sleep habits changed? Check out the following graph on life expectancy:
[caption id="attachment_5561" align="aligncenter" width="300"]
 Life expectancy dropped from 88 in 2000 to 82 in 2010.
Looking at the graph above we see life expectancy dropped from 2000 to 2010. Does this mean eating fewer carbs is related to lower life expectancy? Or vice versa? Not necessarily. And that's the point. At best this is about correlation and not causation.
I remember a colleague showing a graph indicating a change in the use of VCRs during a similar period in a health change. He did this to be ridiculous and show how two things happening at the same time don't mean any type of relationship other than time.
The other thing to note about the graph is that it doesn't account for all types of populations. Obese individuals would be ones with a BMI over 30. Would we see the same trend for those that are overweight? What about for those with BMIs between 15-25? What would the graph look like for lean or athletic people? Is the same trend expected for all adults? Is it different for the elderly? Or adolescents?
What else jumps out a me is the grams of carbs being eaten per day. The range is approximately 1600-2000 carb calories per day. This is a lot of carbs!
There are lot of people that don't eat this many calories in a day, let alone this many carb calories in a day.
If we use a common macro-nutrient breakdown of 40:30:30 (carbs:protein:fat) this equates to eating 4000-5000 calories per day. And 40% of calories as carbs is considered a very low carbohydrate diet or a VLCD.
It shouldn't come as a shock to anyone that eating 4000-5000 calories per day as an adult will lead to obesity. I'd be curious to what the graph would look like for people eating between 1500-2000 calories per day?
Lastly, we don't know anything about the quality of carbohydrate consumed? Does it matter if I eat sweet potatoes or drink a cola? Would it make a difference if I eat Coco Puffs or steal cut oatmeal? The answer is both quality and quantity matter. You can't ignore one and simply focus on the other. Calories matter. And the quality of your food matters.
To summarize, the take home message is to ask lots of questions when you see a graph 'proving' something. Usually if we hear a claim, our response is 'where's the science?'. And then when a polished graph with the appropriate units is presented we could very easily nod along and accept the 'evidence' as truth.
If you want to dig into this graph a little more there the reference:
USDA Economic Research Service, CDC NHANES Surveys
Adapted by Dr. Stephen Guyenet
Stay Informed
When you subscribe to the blog, we will send you an e-mail when there are new updates on the site so you wouldn't miss them.
Comments